
Course Overview
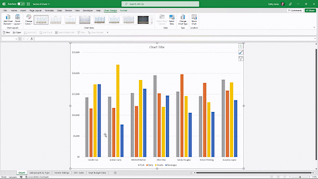
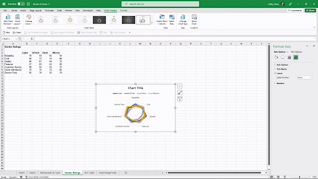
Excel charts are tools used to present data. This training explores working with advanced charts in Microsoft Excel 365.
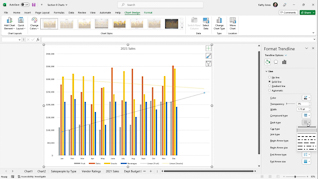
This course explores how to upgrade chart presentations in Excel 365. Viewers learn how to work with combo charts to present complicated information. This training also demonstrates using trend lines for forecasting.
Microsoft Excel 365 offers flexible ways to create and manage charts. Use this training to educate employees about improving their charts in Microsoft Excel 365.

Key Audience
Excel 365 users
Course Topics
Customize Charts
Combo Charts
Trendlines
Chart Templates
Course Detail
Course ID
bbrnmead6_vod
Time
22-24 MIN
Questions
2
Languages
en
video format
HD
captions
No
Resources
Yes
Lessons
4
Remediation
Yes
Bookmarking
Yes
Feedback
No
Microlearning
No