Course Overview
Effective business planning begins with good data and continues with skillful analysis of numbers. The process of creating accurate financial forecasts can be grueling without strong knowledge of key tools. Microsoft Excel 2010 features a variety of tools to simplify your business analytics. Trend and scenario functions have been improved for MS Excel 2010 and new features like “Sparklines” have been added to display more data in a smaller visual space. In less than 20 minutes, an expert facilitator will review the associated menus and functions of these features. Video demonstration and a quiz will lead to stronger knowledge transfer and ensure your learners can implement their new skills on the job!

Key Audience
Microsoft Excel 2010 Users
Course Topics
Analyzing Data
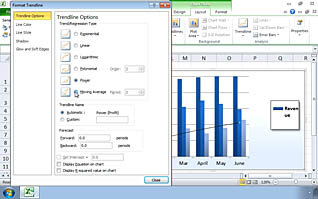
Creating a Trendline
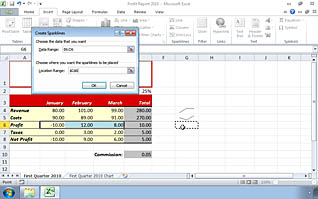
Creating Sparklines
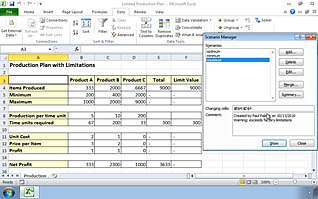
Creating Scenarios
Performing a What If Analysis Solve
The Solver Parameters Dialog Box
Course Detail
Course ID
sonieada_vod
Time
44-49 MIN
Questions
5
Languages
en
video format
HD
captions
No
Resources
No
Lessons
6
Remediation
Yes
Bookmarking
Yes
Feedback
Yes
Microlearning