Course Overview
This training program reviews ways to create, modify, and format charts to present professional information in a more visually appealing way. By showing the viewer how to create a chart through the Microsoft Excel 2010 platform, this training demonstrates steps to improve visual aspects of your business. Because creating charts and graphs can be somewhat tedious at times, the program uses a step-by-step formatting guide to show the viewer how to create several forms of charts. Sizing and resizing charts in any style is looked at. This video shows the viewer how to modify already existing charts, so business professionals can improve material they already have. This training is a must for anyone working closely with data or charts on a daily basis.

Key Audience
Executives, business professionals, or any employees who wish to improve the visual aspects of their business data through Microsoft Excel
Course Topics
Presenting Data Using Charts
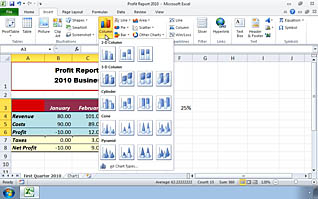
Creating a Chart
Moving and Resizing Charts
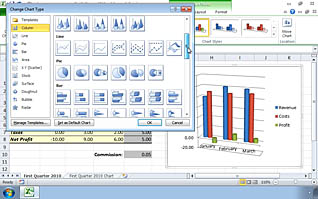
Changing Chart Type
Formatting Charts
Chart Data Ranges
Format Axis
Labels
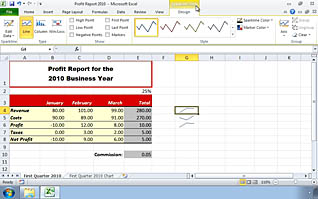
Sparklines
Course Detail
Course ID
soniepdu_vod
Time
66-74 MIN
Questions
8
Languages
en
video format
HD
captions
No
Resources
No
Lessons
9
Remediation
Yes
Bookmarking
Yes
Feedback
Yes
Microlearning