Course Overview
This course takes a deeper look at how to analyze data by using PivotTables in Excel 2016. You must be able to organize your data so it is easy to understand and interpret. You can also filter the data found in a PivotTable or change the format of the PivotTable itself to ensure you have provided enough functionality without cluttering the overall experience. This course shows you how to accomplish these tasks. A PivotTable is a powerful feature in Excel. It allows you to extract specific pieces of information from a larger set of data; in short, it allows you to focus on what you determine to be the important parts of that data. Utilize the information presented here and understand how to better sort, analyze, and present your data through PivotTables.

Key Audience
Excel 2016 users
Course Topics
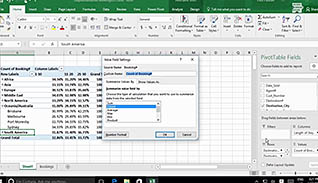
Summarize PivotTable Data
Organize PivotTable Data
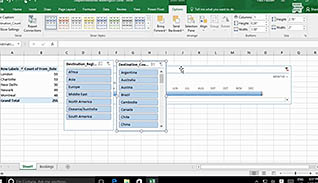
Filter PivotTable Data
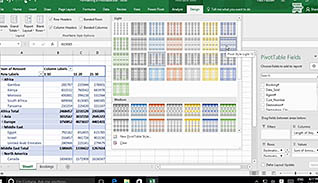
Format a PivotTable
Refresh and Change PivotTable Data
Course Detail
Course ID
sonie16pt_vod
Time
29-37 MIN
Questions
8
Languages
en
video format
HD
captions
Yes
Resources
Yes
Lessons
5
Remediation
Yes
Bookmarking
Yes
Feedback
Yes
Microlearning